

All I got from his is:
"The Earth is only slightly more dense than a flea."
:-P
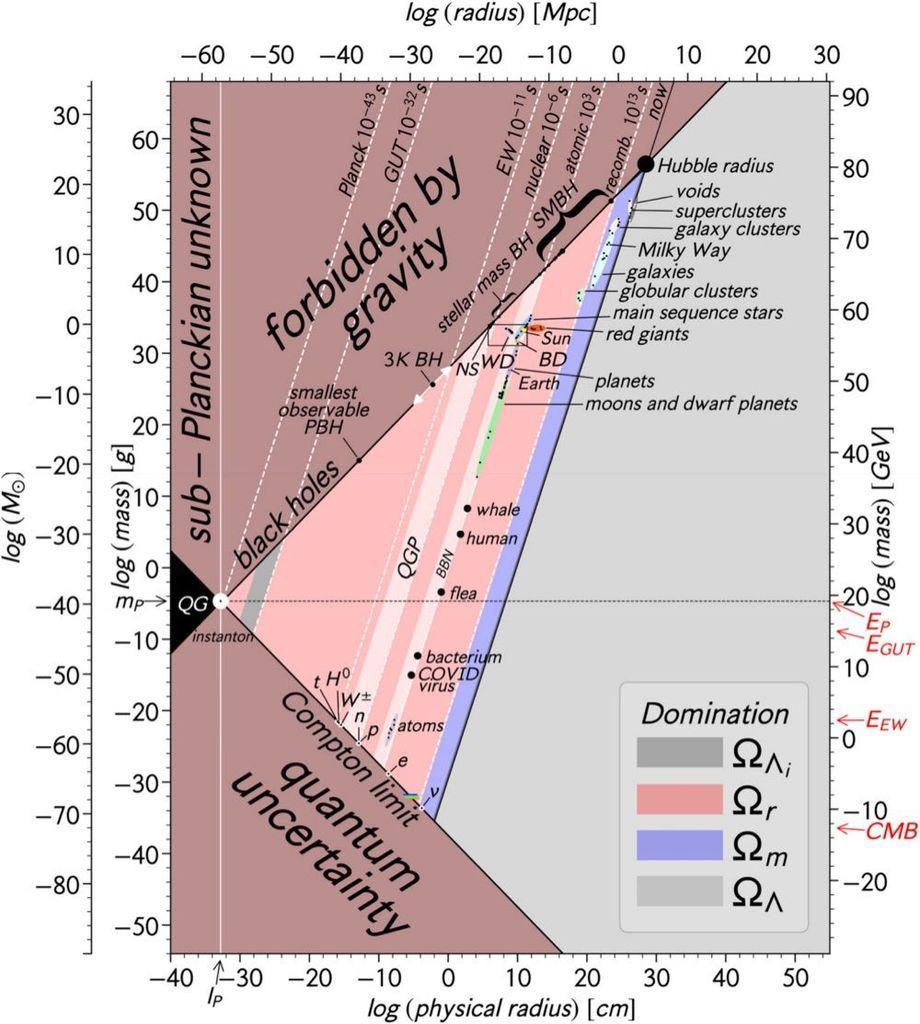
This chart shows all objects in the Universe, arranged by mass (vertical) and radius (horizontal).
The edge of the upper left corner is the "Schwarzschild radius" - anything here becomes a black hole, so we don't expect there's stuff in that corner.
The edge of the lower left corner is the "Compton wavelength" - anything here has a size so small that measuring its position that accurately would require enough energy to create a new one.
These two corners intersect in a white dot misleadingly called "instanton" - that's not the right name for it. It's really a black hole so small its Schwarzschild radius is its Compton wavelength. Its mass is the Planck mass, and its radius is the Planck length.
The pink strips of slope 3 are lines of constant density. For example "QGP" is the density of quark-gluon plasma, "BBN" is the density of the universe when Big Bang nucleosynthesis was going on, and so on.
The Earth is only slightly more dense than a flea, and that makes sense!
The black dot labeled "Hubble radius" is the whole observable universe.
I like this chart a lot but I would get rid of that word "instanton". It's from here:
C. H. Lineweaver and V. M. Patel, “All objects and some questions”, American Journal of Physics 91 (2023), 819-825. Free at https://www.researchgate.net/publication/374231292_All_Objects_and_Some_Questions
See the alt text for more!