Event JSON
{
"id": "89cb5c27cc0e8d7aad10849cec5a860f0b7aa27687e65b42ab14373be8eb61f5",
"pubkey": "191be4f2f1c47498af28760e53f6dadaddfeedb6bd3cbfcaf47775ccf77bd628",
"created_at": 1776690750,
"kind": 1,
"tags": [
[
"imeta",
"url https://files.mastodon.social/media_attachments/files/116/437/163/788/221/009/original/4c55f9bb0ab30a9e.png",
"m image/png"
],
[
"imeta",
"url https://files.mastodon.social/media_attachments/files/116/437/263/280/983/126/original/1554b7494d2c2ce5.png",
"m image/png"
],
[
"proxy",
"https://mastodon.social/@baekdal/116437205037930692",
"web"
],
[
"proxy",
"https://mastodon.social/users/baekdal/statuses/116437205037930692",
"activitypub"
],
[
"L",
"pink.momostr"
],
[
"l",
"pink.momostr.activitypub:https://mastodon.social/users/baekdal/statuses/116437205037930692",
"pink.momostr"
],
[
"-"
]
],
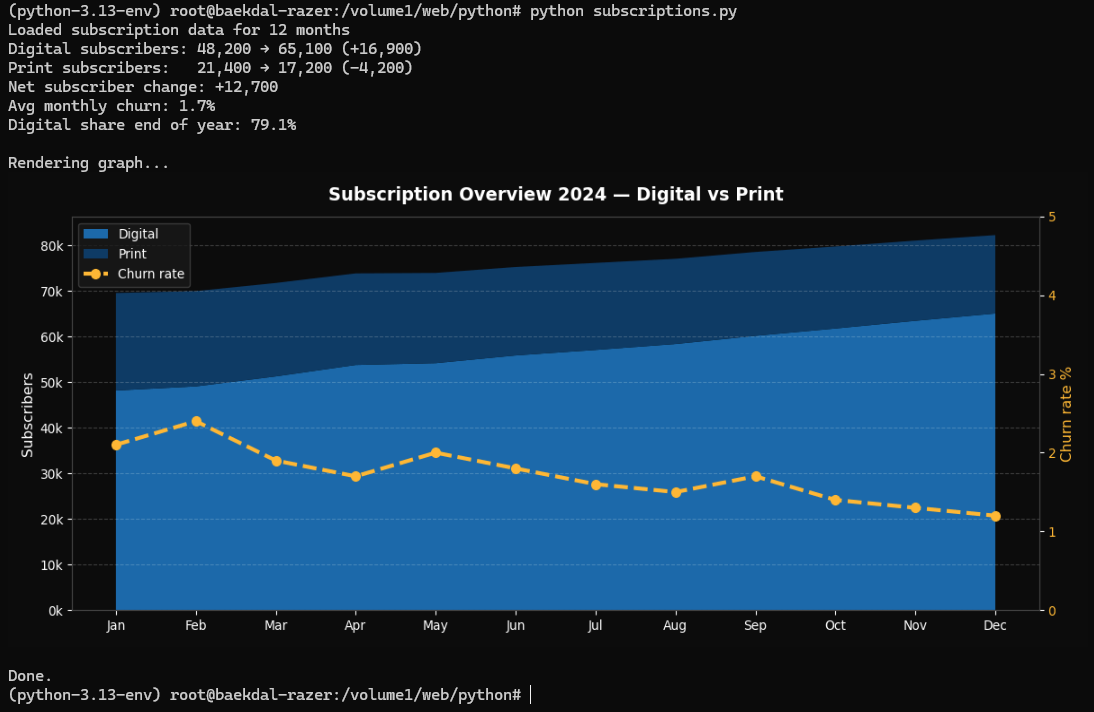
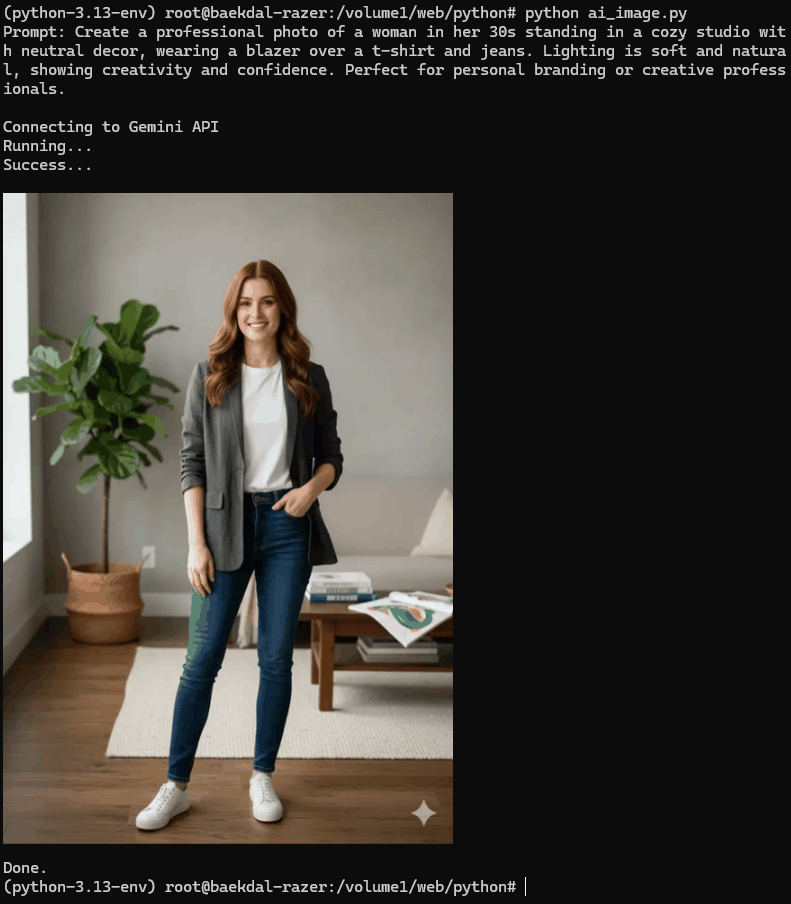
"content": "One of the problems I have always had when doing data analysis in Python is that it is running in the terminal, and terminals look like something from the 1960s. \n\nWhat if, for instance, I'm creating a graph or an image? \n\nWell, by default, I would either have to save that as a file and then open it, or call .show(), which would show the graph in a second window. But, what I want is to show the graph inline as an actual pixel-perfect image.\n\nWell... look at this (see link in comment)\nhttps://files.mastodon.social/media_attachments/files/116/437/163/788/221/009/original/4c55f9bb0ab30a9e.png\nhttps://files.mastodon.social/media_attachments/files/116/437/263/280/983/126/original/1554b7494d2c2ce5.png\n",
"sig": "1b520365ecf22de99fd59fde6dc4849f8cfde417bab915d91d91ce36c4dd56e4a976dcbb48a93b68025924c213a604a0ca7670b47819554db91c03d6307390cb"
}