John Carlos Baez on Nostr: This chart shows all objects in the Universe, arranged by mass (vertical) and radius ...
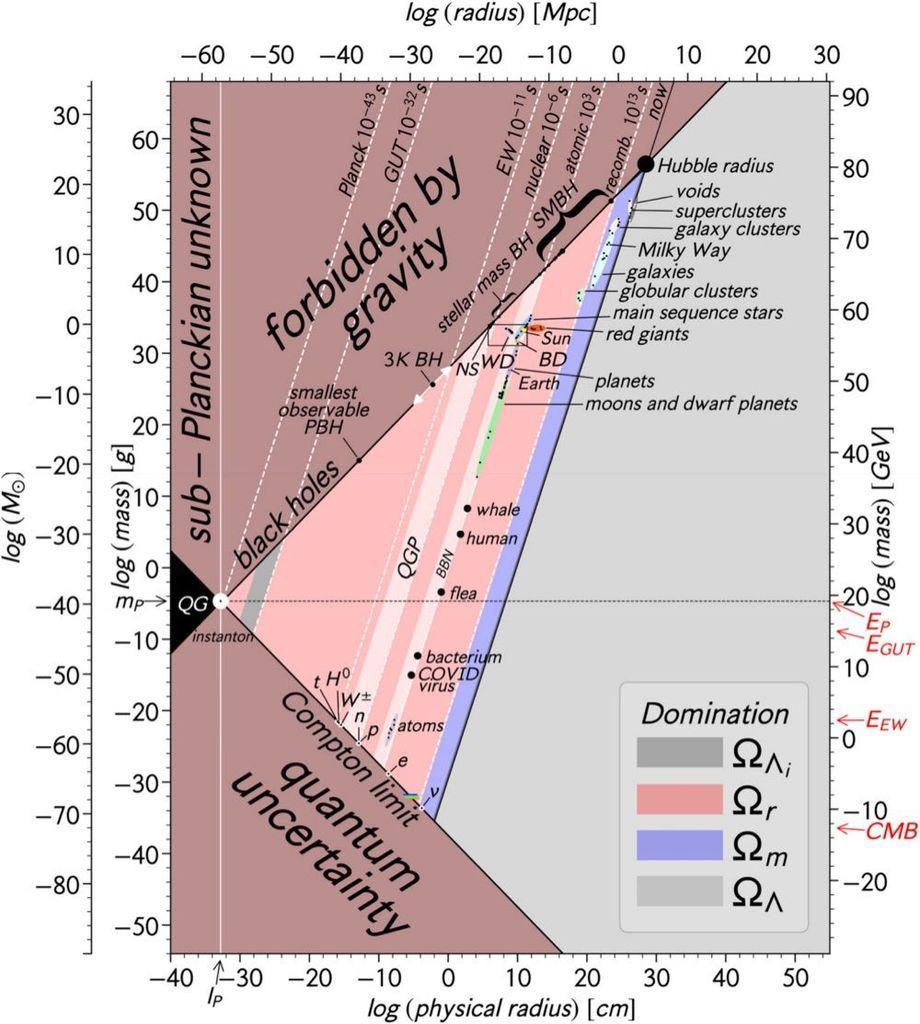
This chart shows all objects in the Universe, arranged by mass (vertical) and radius (horizontal).
The edge of the upper left corner is the "Schwarzschild radius" - anything here becomes a black hole, so we don't expect there's stuff in that corner.
The edge of the lower left corner is the "Compton wavelength" - anything here has a size so small that measuring its position that accurately would require enough energy to create a new one.
These two corners intersect in a white dot misleadingly called "instanton" - that's not the right name for it. It's really a black hole so small its Schwarzschild radius is its Compton wavelength. Its mass is the Planck mass, and its radius is the Planck length.
The pink strips of slope 3 are lines of constant density. For example "QGP" is the density of quark-gluon plasma, "BBN" is the density of the universe when Big Bang nucleosynthesis was going on, and so on.
The Earth is only slightly more dense than a flea, and that makes sense!
The black dot labeled "Hubble radius" is the whole observable universe.
I like this chart a lot but I would get rid of that word "instanton". It's from here:
C. H. Lineweaver and V. M. Patel, “All objects and some questions”, American Journal of Physics 91 (2023), 819-825. Free at
https://www.researchgate.net/publication/374231292_All_Objects_and_Some_QuestionsSee the alt text for more!
Published at
2025-12-14 19:13:54 UTCEvent JSON
{
"id": "4b987f272da385802511074029c44258fe8967b15035e4a8fd0ac45e4a8e658f",
"pubkey": "9a6a1a8eefd0b53d7e0c966ab35bd904151246f03b1be98fa0d2d0eeb4940320",
"created_at": 1765739634,
"kind": 1,
"tags": [
[
"imeta",
"url https://media.mathstodon.xyz/media_attachments/files/115/719/391/434/780/599/original/96d8298c20dfbad5.jpeg",
"m image/jpeg"
],
[
"proxy",
"https://mathstodon.xyz/@johncarlosbaez/115719512715850824",
"web"
],
[
"proxy",
"https://mathstodon.xyz/users/johncarlosbaez/statuses/115719512715850824",
"activitypub"
],
[
"L",
"pink.momostr"
],
[
"l",
"pink.momostr.activitypub:https://mathstodon.xyz/users/johncarlosbaez/statuses/115719512715850824",
"pink.momostr"
],
[
"-"
]
],
"content": "This chart shows all objects in the Universe, arranged by mass (vertical) and radius (horizontal). \n\nThe edge of the upper left corner is the \"Schwarzschild radius\" - anything here becomes a black hole, so we don't expect there's stuff in that corner.\n\nThe edge of the lower left corner is the \"Compton wavelength\" - anything here has a size so small that measuring its position that accurately would require enough energy to create a new one.\n\nThese two corners intersect in a white dot misleadingly called \"instanton\" - that's not the right name for it. It's really a black hole so small its Schwarzschild radius is its Compton wavelength. Its mass is the Planck mass, and its radius is the Planck length.\n\nThe pink strips of slope 3 are lines of constant density. For example \"QGP\" is the density of quark-gluon plasma, \"BBN\" is the density of the universe when Big Bang nucleosynthesis was going on, and so on. \n\nThe Earth is only slightly more dense than a flea, and that makes sense!\n\nThe black dot labeled \"Hubble radius\" is the whole observable universe.\n\nI like this chart a lot but I would get rid of that word \"instanton\". It's from here:\n\nC. H. Lineweaver and V. M. Patel, “All objects and some questions”, American Journal of Physics 91 (2023), 819-825. Free at https://www.researchgate.net/publication/374231292_All_Objects_and_Some_Questions\n\nSee the alt text for more!\nhttps://media.mathstodon.xyz/media_attachments/files/115/719/391/434/780/599/original/96d8298c20dfbad5.jpeg\n",
"sig": "9f44e29b26b14b077d5565ebfaba7d70b9a2d211d7784ff2ab5500b9ae1a8e60545471daacce4a30401e75b1564f05049d7a470c34f0bb89d67fd9a6b5b4c9c2"
}